Ichimoku (ICH)
Labels:
INDICATOR
,
INDICATOR STUDY
No comments
Ichimoku (ICH)
Description
The Ichimoku study was developed by Goichi Hosoda pre-World War II as a forecasting model for financial markets. The study is a trend following indicator that identifies mid-points of historical highs and lows at different lengths of time and generates trading signals similar to that of moving averages/MACD. A key difference between Ichimoku and moving averages is Ichimoku charts lines are shifted forward in time creating wider support/resistance areas mitigating the risk of false breakouts.
Formula
Turning Line = ( Highest High + Lowest Low ) / 2, for the past 9 days
Standard Line = ( Highest High + Lowest Low ) / 2, for the past 26 days
Leading Span 1 = ( Standard Line + Turning Line ) / 2, plotted 26 days ahead of today
Leading Span 2 = ( Highest High + Lowest Low ) / 2, for the past 52 days, plotted 26 days ahead of today
Cloud = Shaded Area between Span 1 and Span 2
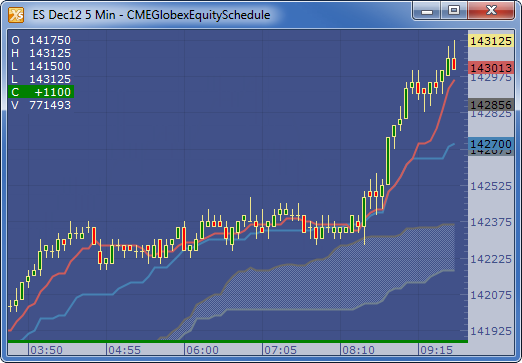
Example
Subscribe to:
Post Comments
(
Atom
)


No comments :
Post a Comment