Bollinger Band (BBANDS)
Labels:
INDICATOR
,
INDICATOR STUDY
No comments
Bollinger Band (BBANDS)
Description
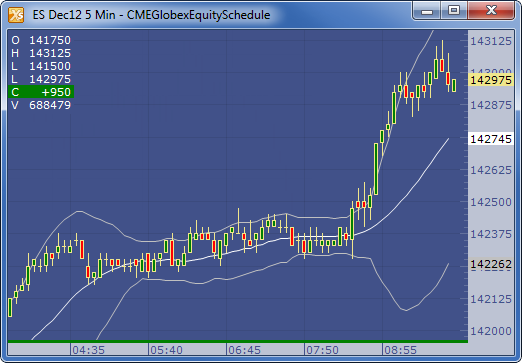
The Bollinger Band (BBANDS) study created by John Bollinger plots upper and lower envelope bands around the price of the instrument. The width of the bands is based on the standard deviation of the closing prices from a moving average of price.
Formula
Simplified:
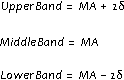
Middle Band = n-period moving average
Upper Band = Middle Band + ( y * n-period standard deviation)
Lower Band = Middle Band - ( y * n-period standard deviation)
Where:
- n = number of periods
- y = factor to apply to the standard deviation value, (typical default for y = 2)
Detailed:
- Calculate the moving average. The formula is:

- Pn is the price you pay for the nth interval
- n is the number of periods you select
- Subtract the moving average from each of the individual data points used in the moving average calculation. This gives you a list of deviations from the average. Square each deviation and add them all together. Divide this sum by the number of periods you selected.
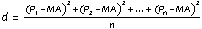
- Take the square root of d. This gives you the standard deviation.

- Compute the bands by using the following formulas:
Example
Subscribe to:
Post Comments
(
Atom
)


No comments :
Post a Comment